Deception & Misdirection
A “Dark Money” Assault on U.S. Elections: Unmasking CPAF’s Origins
How one billionaire’s private foundation is influencing our elections from Bermuda
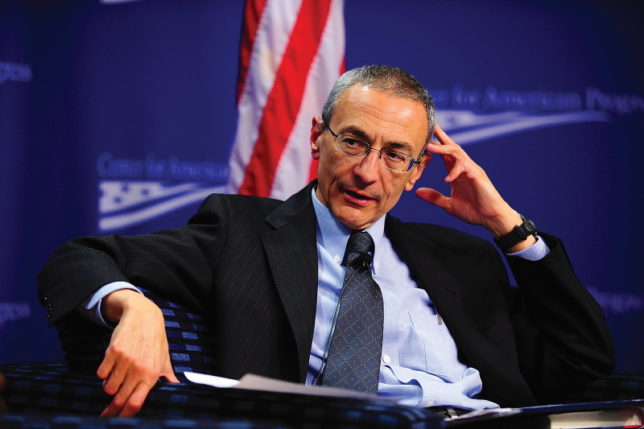 As it turns out, the story doesn’t begin with CPAF or even with Atlantic Philanthropies. Rather, the story begins with a cryptic email from the president of another private foundation to John Podesta. Credit: Center for American Progress. License: https://bit.ly/2tASxQW.
A “Dark Money” Assault on U.S. Elections (full series)
Atlantic Philanthropies | Meet the Team
Unmasking CPAF’s Origins | Was CPAF Successful?
Summary: Atlantic Philanthropies, a foreign entity based in Bermuda, has spent millions in dark money influencing American politics. Through funding Health Care for America Now, it is credited with almost single-handedly leading the campaign behind Congress’s passage of Obamacare. Atlantic’s latest venture is the Civic Participation Action Fund, with a five-year mission of using targeted voter registration to transform red states into blueish-purple toss-ups—leading to Democrats winning more seats in Congress and ultimately the presidency. The fund continues to fly under the radar of public attention while maintaining the appearance of nonpartisanship, and this deceptive behavior damages the American political discourse and indicates dubious intentions.
Unmasking CPAF’s Deceptively Partisan Origins
Along with his email to the Wyss Foundation, Bill Roberts attached both a Microsoft Word document and a PDF of the voter-registration plan, but in doing so Roberts made a mistake: He forgot to turn off the “Track Changes” function and accept all the changes. Track Changes records every edit to a document and which user made it so that a reader can see the differences between the original and edited versions. This means that we can see all the “notable changes” Roberts made to his plan before he sent it to the Wyss Foundation. And the tracked changes reveal an entire arsenal of tactics that left-wing nonprofits use to conceal partisan intentions behind walls of philanthropy and intentionally milquetoast words such as “civic engagement.”
To make his project compliant for 501(c)(3) nonprofits, Roberts consistently softened or removed partisan language throughout the document.
The first important change was in the introduction, where Roberts edited the plan to mask the program’s focus on a set of desired political outcomes, not just blanket civic participation among minorities. Note that in the quotations below deletions are shown in red; insertions are shown in green.
Although much more work is needed to flesh out a full plan, particularly on the important challenge of program implementation, the quantitative analysis is intriguing and the potential political voter participation outcomes are enormous.
This shows that Corridor Partners’ plan viewed voter participation as merely the means to a political end. This edit alone shows that the plan is nowhere near as altruistic as it pretends.
Further along, in a summary of the potential political outcomes, are more illuminating changes:
. . . if it were fully implemented at the scale suggested by our experts’ analysis, the program has the potential to impact policies affecting millions of citizens and guide hundreds of billions of dollars in government funding into environment, health, energy, and other initiatives.
Roberts struck any mention of funneling “hundreds of billions of dollars in government funding” toward furthering the left-wing agenda. While most nonprofits duck and dodge when accused of supporting the left-wing agenda, this edit paints CPAF into a corner.
After explaining his goals, Roberts tips his hand further, revealing that he intends to produce results for one specific political party. In its original format, the document included three example elections in which their program could have hypothetically made a difference:
Voter participation by people of color has improved somewhat in recent years, but their continued absence from the political process has almost certainly had a skewed impact on both elections and policy. Here are three illustrative examples from recent elections:
All three example elections were races where Republicans won by a thin margin: the 2012 Senate races in Nevada and Arizona and the 2010 Florida governor’s race. Corridor’s report originally claimed that, if their program had been enacted, new voters at the polls could, “potentially [alter] the outcome of the race.” Just like the rest of the partisan language in the report, Roberts removed it.
The edits underneath the high-minded language about promoting civic engagement show CPAF’s funders cared specifically about influencing elections and picking candidates. Roberts noted the possibility that his project could promote public policy changes—something that 501(c)(3) organizations are allowed to do—but only as an after-thought to give the program the appearance of nonpartisanship.
In a summary of the plan’s methodology, Roberts made the following change:
Academic research confirms that voter interest, particularly for low propensity voters, is closely tied to the outcome competitiveness of an election.
This again demonstrates that the purpose of the “registration surge” is to influence the outcome of elections, something that 501(c)(3) entities are expressly forbidden from doing.
Just as interesting as the things that Bill Roberts did change are the things that he didn’t.
Although he trimmed the partisan language of the original, the main body of his work remains entirely unchanged, including the recommendations, costs, statistics, and sources.
The crux of Robert’s plan appears at the end of the document: a detailed spending table organized by state and year, designed to produce the best results. It centers on eight key states: Arizona, Colorado, Florida, Georgia, Illinois, North Carolina, New Mexico, and Nevada—all CPAF target states.
Table 1. Robert’s Spending Table
| Target Type | State | Costs | ||||||
| 2015 | 2016 | 2017 | 2018 | 2019 | 2020 | Total | ||
| States Where Vote Margin Can Be Closed Through Voter Registration Alone | Arizona | $1,406,076 | $4,030,517 | $1,541,382 | $4,452,370 | $1,537,239 | $4,406,457 | $17,374,042 |
| Colorado | $708,705 | $2,031,344 | $709,327 | $2,048,932 | $690,105 | $1,978,041 | $8,166,454 | |
| Florida | $2,042,469 | $5,845,677 | $2,293,843 | $6,625,895 | $0 | $0 | $16,807,884 | |
| Georgia | $1,474,680 | $4,208,870 | $1,623,019 | $4,688,182 | $1,767,502 | $5,044,091 | $18,806,345 | |
| Illinois | $1,724,698 | $4,936,744 | $1,802,187 | $5,205,718 | $1,804,043 | $5,163,448 | $20,636,839 | |
| North Carolina | $755,015 | $2,153,791 | $883,518 | $2,552,093 | $942,599 | $2,690,462 | $9,977,477 | |
| New Mexico | $594,253 | $1,702,462 | $587,198 | $1,696,155 | $579,114 | $1,658,887 | $6,818,069 | |
| Nevada | $500,156 | $1,431,402 | $518,530 | $1,497,804 | $556,908 | $1,594,964 | $6,099,764 | |
| Total | $9,206,052 | $26,340,807 | $9,959,006 | $28,767,148 | $7,877,510 | $22,536,350 | $104,686,873 | |
Also in Table 1 is the final price tag and duration of the project. The minimum estimated cost of the whole project is just over $100 million from 2015 to 2020—CPAF’s stated lifespan. So far, CPAF has received roughly $50 million in grants, precisely half of the project’s total cost. CPAF’s state grantmaking is also consistent with Table 1 in both 2016 and 2017. For example, some of the recommendations for 2016 include directing roughly 15 percent of funding to Arizona, 22 percent to Florida, 7 percent to North Carolina, and 5 percent to New Mexico. An analysis of the organizations CPAF made grants to during 2016 shows nearly identical percentages of its funding were directed toward each of these key states, and similar trends were observed in 2017 as well.
The projected numbers of votes generated by the program also remain untouched, methodically separated by race and totaled under “Total Non-White” votes. The 2018 projections estimate that the program would generate nearly 1 million new “non-white” votes; 293,000 from African Americans and 520,000 from Hispanic-Americans. The 2020 projections, shown in Table 2, anticipate more than doubling the 2018 numbers to an estimated 2.4 million new votes by 2020.
| Table 2. Estimated Net Votes Generated in 2020 Election, by State and by Race and Ethnicity | ||||||
| State | African American | Hispanic American | Asian American | Other Non-White | Total Non-White | Vote Margin |
| Arizona | 18,750 | 133,584 | 26,981 | 19,321 | 198,635 | 153,657 |
| Colorado | 13,219 | 59,779 | 15,846 | 3,989 | 92,832 | 67,520 |
| Connecticut | 18,837 | 17,831 | 8,460 | 2,595 | 47,722 | 87,281 |
| Florida | 51,666 | 83,860 | 27,713 | 9,444 | 172,684 | 110,701 |
| Georgia | 144,931 | 31,969 | 29,057 | 12,531 | 218,487 | 216,431 |
| Illinois | 94,483 | 104,866 | 33,684 | 3,219 | 236,252 | 149,779 |
| North Carolina | 72,498 | 21,214 | 6,880 | 15,485 | 116,077 | 74,926 |
| New Mexico | 3,411 | 53,904 | 2,438 | 17,872 | 77,626 | 53,381 |
| Nevada | 11,570 | 40,580 | 7,419 | 10,529 | 70,099 | 51,246 |
| Pennsylvania | 75,129 | 49,086 | 12,918 | 20,036 | 157,168 | 270,071 |
| South Carolina | 64,000 | 4,753 | 3,043 | 5,321 | 77,116 | 151,305 |
| Texas | 140,208 | 644,360 | 53,016 | 24,220 | 861,804 | 946,241 |
| Virginia | 26,974 | 10,354 | 15,272 | 6,828 | 59,427 | 111,566 |
In the next installment of “A ‘Dark Money’ Assault on U.S. Elections,” see how successful CPAF has been.