Doing Good
Government Fail: Public Education
This post is part of Doing Good: Effective Alternatives to the Welfare State, July 2016. For the full PDF, click here.
In 2012, the U.S. high school graduation rate reached 80.8 percent, the all-time high. While this is a sharp improvement—a 6 percent increase in just five years—it still means that one in five students fails to graduate within four years of entering high school.
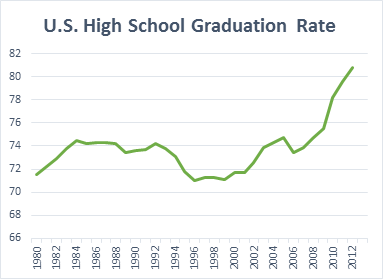
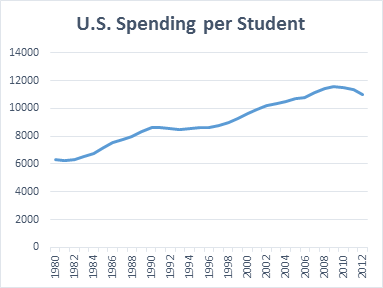
Over the past few decades, we as a nation have increased our spending on students considerably. In 1980, we were spending $6,321 per student on average, and by 2012, we were spending $11,014. Personally, when I pay for something, I expect results. What has almost doubling per-student spending bought us? Less than a 10 percent increase in graduation rates over 32 years.
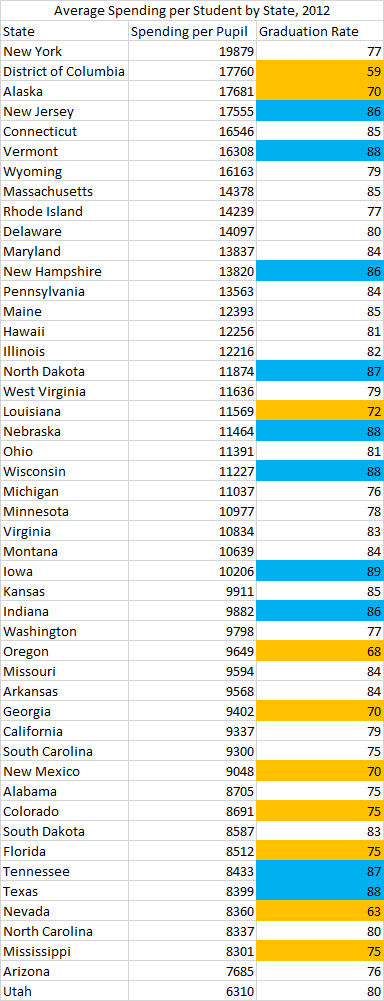
The results of our spending look similarly lackluster when viewed from the state level. The following table shows the states (excluding Idaho, Kentucky, and Oklahoma due to a lack of data) in order of which state spends the most per pupil to the least. In the graduation-rate column, blue highlighting indicates the 10 highest state-level graduation rates, and yellow highlighting indicates the 10 lowest.
Of the 10 states that spent the most per pupil on public education in 2012, only two of them had graduation rates within the top 10.
On the other hand, of the 10 states that spent the least per student, only four were amongst the states with the 10 lowest graduation rates.
Most interesting are the states that spend more but have low graduation rates, and the states that spend less but have high graduation rates. In the former category are Alaska and the District of Columbia. In the latter are Texas and Tennessee. Both Alaska and the District spend nearly $18,000 per student annually, but only 59 percent of D.C. public school students graduated within four years of entering high school as of 2012, and only 70 percent of Alaskan students did.
Texas and Tennessee, while spending less than $8,500 per student annually, achieved graduation rates of 88 and 87 percent in 2012, respectively. Clearly, spending more on students is not helping them to graduate, nor is spending less causing them to fail.
![]()
Fortunately, another option exists. The average cost of private school tuition for the 2011–2012 school year was $10,740—a few hundred dollars fewer than we’re spending per student in public school. In the 2010–2011 school year, 97.8 percent of private school seniors graduated. Of those graduates, 64.2 percent were enrolled in college the following fall semester. If private school is less expensive and considerably more effective than public school, why are we still paying to send American students to the lesser of the two? The private sector has proven itself capable of effectively educating students. The public sector has proven itself capable of wasting our money.
All data for this post is from the National Center for Education Statistics.