Organization Trends
Represent.US’s Flawed Gerrymandering Forecast
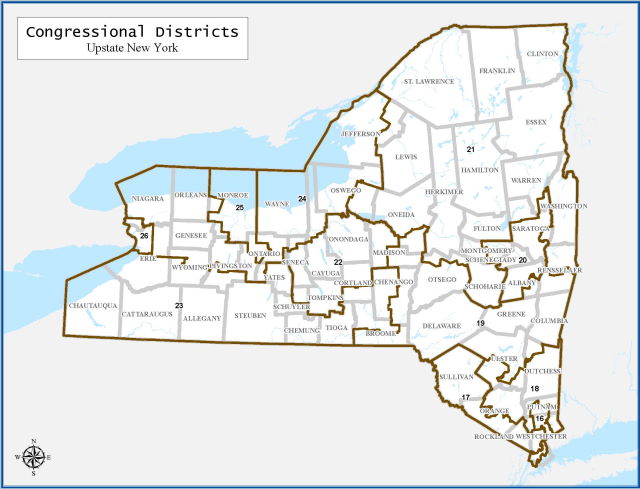 2022 New York congressional districts as approved by the New York legislature and ruled against by a lower court judge on March 31, 2022. Credit: New York State Legislative Task Force on Demographic Research and Reapportionment.
As the midterm elections approach and the 2020 Census recedes into the past, states are finalizing their congressional district maps, subject to the litigation that always accompanies acts as politically consequential as deciding the electorates for legislative elections. As these maps are finalized, we can look back at certain predictions and see which observers more accurately predicted the likelihood of “gerrymandering,” that is politicians and activists mapping in manners favorable to their own party.
I use “and activists” deliberately. Groups, especially those on the political left like Represent.US, push supposedly “independent” redistricting commissions as a solution to this political gamesmanship, but as I demonstrated in Capital Research Center’s report “The Myth of Nonpartisan Districts,” these commissions can yield maps as “biased” as open partisan gerrymanders. And Represent.US’s “Gerrymandering Threat Index” of the 2021 redistricting cycle demonstrates that the skeptical view of commission redistricting is justified.
What They Got Right
I do not argue that legislators do not draw districts to advantage themselves and their allies. This is obviously true and has occurred in every redistricting cycle since at least the second one. (Elbridge Gerry signed the original “Gerry-mander” in 1812.) Thus, it is not surprising that large Democratic states like Illinois, large Republican states like Texas, small Democratic states like Nevada, and small Republican states like Oklahoma that Represent.US predicted had “extreme” likelihoods of gerrymandering would pass maps expected to yield nonproportional results in a fashion advantageous to the drawing party in a neutral year early in the Census cycle. (As Republican-aligned mapmakers in New Jersey discovered last cycle, however, non-neutral years late in the Census cycle recall the adage about “the best laid plans of mice and men.”)
Not all commission states judged to have “low” or “minimal” risk were gamed by closet partisans or bad institutional designs into outright or de-facto gerrymanders. Idaho, Montana, and Hawaii had commissions that drew maps likely to yield two-nil whitewashes for the states’ majority parties, which may very well be what proportional representation for two seats in those strongly partisan-aligned states would predict. Michigan, Colorado, and Virginia all drew maps likely to reflect roughly proportional representation, though Virginia’s was drawn by courts after its redistricting commission completely failed.
Houses Divided
Not all states that employ legislative redistricting had as disproportionate maps as Represent.US predicted, either. West Virginia was adjudged to have an “extreme” risk of gerrymandering, but a 2-0 Republican map was always the likeliest (and most likely mathematically proportional) map in one of the country’s most Republican states.
Divided states also obtained relatively equitable maps. Pennsylvania, judged a “moderate” risk, had maps that went to a judicial draw after the state’s Democratic governor and Republican legislature deadlocked. The map the state’s courts drew will likely approximate proportionality. Minnesota’s split legislature and Democratic governor also deadlocked to the courts, which adopted a close-to-proportional least-change map, despite having been at “extreme” risk of gerrymandering.
Wisconsin, judged an “extreme” risk, also went to the judiciary after a Democratic governor and Republican legislature deadlocked. The court adopted the Democratic governor’s version of the directed least-change (versus a 2010s map drawn by a Republican trifecta) map.
While Wisconsin’s map favors Republicans, that outcome has as much to do with geography as partisan meddling. “People’s Maps Commissions” convened by the Democratic governor did not devise a proportional map even by “cracking” staunchly Democratic Milwaukee, yielding a 5-2 Republican-Democratic split with the eighth district highly competitive. “Cracking”—that is, the division of cities, neighborhoods, counties, or other communities—is considered one of the two hallmarks of gerrymandering. In a neutral year, a proportional single-member constituency map of Wisconsin essentially cannot be drawn without extensive gerrymandering.
Bull-Rushing Partisans
Represent.US also predicted “low” or “minimal” risks of gerrymandering in states that future editions of the proportionality analysis from “The Myth of Nonpartisan Districts” may identify as among the most disproportional unless court fights intervene. Represent.US predicted that Ohio and New York had “low” risks despite strong Republican and Democratic trifectas, respectively, and histories of apparent gerrymandering, presumably because both states passed measures after the 2010 redistricting to limit how aggressively districts could be drawn.
Instead, both trifectas bull-rushed past those measures and into court by drawing maps that even their co-partisans recognized as outright gerrymanders. As of writing, both maps are in litigation, but it is entirely possible that New York will go into the 2022 congressional elections with a map more Democratic than its disproportionally Democratic map from the 2010s and Ohio will go into the 2022 elections with a map more Republican than its Republican map from the 2010s.
But a defender of Represent.US might say those states did not put all district-drawing power into a commission, allowing legislatures to interfere. Enter New Jersey, judged to be a “low” risk of gerrymandering. Its maps were sent to court because its commission of political figures that drew congressional maps adopted the Democrats’ proposed map, which favors Democrats in nine of the 12 seats, favors Republicans in two seats, and leaves one competitive seat. The map contains visual evidence of gerrymandering. (The Second District, which favors Republicans, contains a section of Republican-leaning Ocean County that is contiguous to the rest of the district only by water, evidence of “packing” Republican voters. Other districts apparently drawn to advantage Democratic incumbents were also only contiguous by water.) The tiebreaking member of the commission, a Democrat, said he chose the Democratic map because the Republican map was chosen for the 2010s, further evidence of partisan motivation. The state supreme court allowed the map to stand.
Now, New Jersey’s commission is not truly “independent,” with its members chosen by the political parties and their leaders.
Not-So-Independent Results
So how did the “Independent” commissions do? Not as well as Represent.US probably thinks they should have: California and Arizona, both adjudged to have “minimal” gerrymandering risk, returned congressional maps likely to be disproportional in consequential ways.
This will not be a surprise to readers of “The Myth of Nonpartisan Districts,” who would know that California’s “independent commission” yielded a map more Democratic than Texas’s outright partisan gerrymander was Republican during the 2010s. As we warned earlier in the redistricting cycle, the structure and membership of the California commission made another de facto Democratic gerrymander likely. And that is the likeliest outcome of the map the commission drew, with the only change to its partisan lean being the elimination of a Democratic seat because of reapportionment. The seat of Rep. Kevin McCarthy (R-CA), the 20th District, shows strong evidence of being a “pack” of Republican voters. The Republican-supporting election-analysis blog RRH Elections characterized the oddly shaped district as “a classic vote sink, cutting through the Central Valley to pick up the whitest and most Republican precincts in four relatively far-flung cities.”
Arizona’s independent commission ended up as a Bizarro-world New Jersey, with the partisan bias (in the initial draw) flip-flopping from the prior Census period. In the 2010s, the structural flaws of Arizona’s commission allowed the commission chair to side with the Democrats on the commission and enact a de facto Democratic gerrymander that returned majority-Democratic congressional delegations despite Republicans winning the House “popular vote” in the state in two of the five elections contested using those maps. While the 2020-cycle railroading may not have been repeated—the congressional map passed on a bipartisan vote—the outcome may be a partisan mirror of the 2010s. The adopted map has six safe or Republican-leaning seats, meaning a neutral year with baseline-level candidates could easily yield a Republican majority while losing the “popular vote.”
Political Decisions
The lesson of Represent.US’s flawed forecasting is the same one identified by the Supreme Court when it ruled that partisan gerrymandering was a “political question” that it could not adjudicate: Politics is political, no matter what structures one might wish to build to make it less so.
Two Republican-trifecta states’ redistricting decisions illustrate how political all this politics is and must be. Iowa has strict rules to limit “packing” and “cracking” by splitting counties, and civil servants draw the map drafts, but the legislature gets a final vote on the congressional maps. The first map the civil servants presented would likely have yielded a more proportional result since it had a Democratic-leaning district and a competitive district in addition to two safe Republican districts, meaning a neutral-to-good Democratic year could yield a 2-2 map. The Republican legislature rejected it, choosing instead to gamble on a map that could yield a Republican whitewash in a good Republican year but made one of the Republican seats far less safe, opening up a possible 3-1 Democratic majority in a strong Democratic year. The Iowa map now has more competitive seats but may be less proportional: A political choice was made.
The other political-decision state is New Hampshire. State legislative Republicans offered a map that would essentially draw out Rep. Chris Pappas (D-NH) by making his previously competitive district Republican-leaning but protect Rep. Anne Kuster (D-NH) by making her previously competitive district Democratic-leaning. Gov. Chris Sununu vetoed the proposal, offering instead a map with two competitive seats that could yield a whitewash for either party in any given year.
The Iowa and New Hampshire debates about proportionality versus competitiveness illustrate that redistricting is and always will be political. There is no technocratic “answer” to the question of partisan gerrymandering, and the only “solution” is the push and pull of coalition changes and state-level political battles, just as it always has been.